
How Can You Invest in Mutual Funds? The Path to Getting Rich
Have you ever scrolled past someone’s tweet about hitting ₹1 crore through mutual fund SIPs and thought, “Is that even
Have you ever scrolled past someone’s tweet about hitting ₹1 crore through mutual fund SIPs and thought, “Is that even
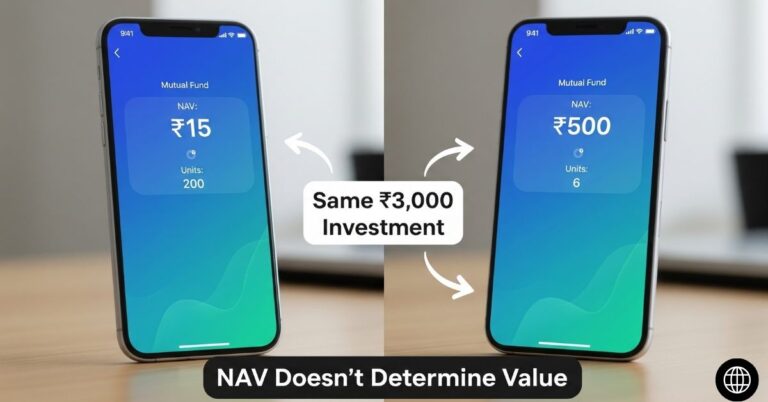
You’re scrolling through mutual fund options on your investment app, and you notice two similar funds. One has a NAV
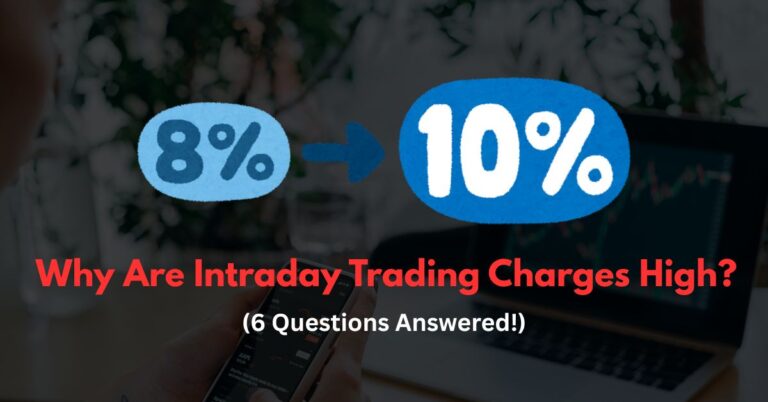
Ever entered a trade thinking, “This one’s gonna be big,” only to find your profit shrank once the charges hit?
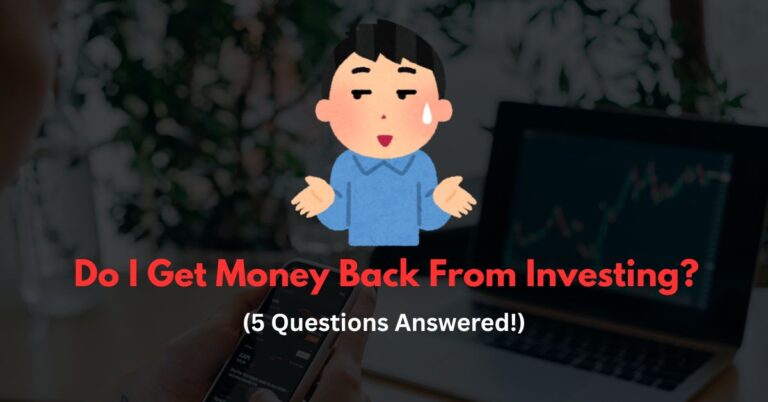
You’ve stashed cash into a mutual fund or stocks, and now you’re checking yourself for signs of panic. Will you

Yes, you can increase your wealth using mutual funds. Mutual funds are a good way to accumulate your wealth. Can

Yes, you can start trading. First, why did you decide to start trading, and why did you choose training? Trading
Yes, you can stop trading, but why are you thinking about stopping trading? If you are not able to trade,

Yes, it is possible to become a billionaire through trading. Many people in India have become billionaires That is from
What Candlesticks Short Patterns mean is a type of financial chart primarily used in technical analysis that reflects the price
This indicator is a technical indicator that is used in day trading, and this indicator shows the market trend. Many