What Candlesticks Short Patterns mean is a type of financial chart primarily used in technical analysis that reflects the price movement of securitie,s product,s currencie,s commodities and other financial achievements over a specific period and candle charts are one of the most powerful tools in technical analysis and show traders critical insight into price action.
And market sentiment, market trend reversals, and show how snakes are essential in trading and market analysis, and In this article, I will tell you How to Read and Understand Candlestick Chartsand how to analyse Candlesticks Charts again I will also explain the different types of Candlesticks Charts so read till the end of this article.
Understand Candlestick Charts
Candlestick Chart/Graphs?
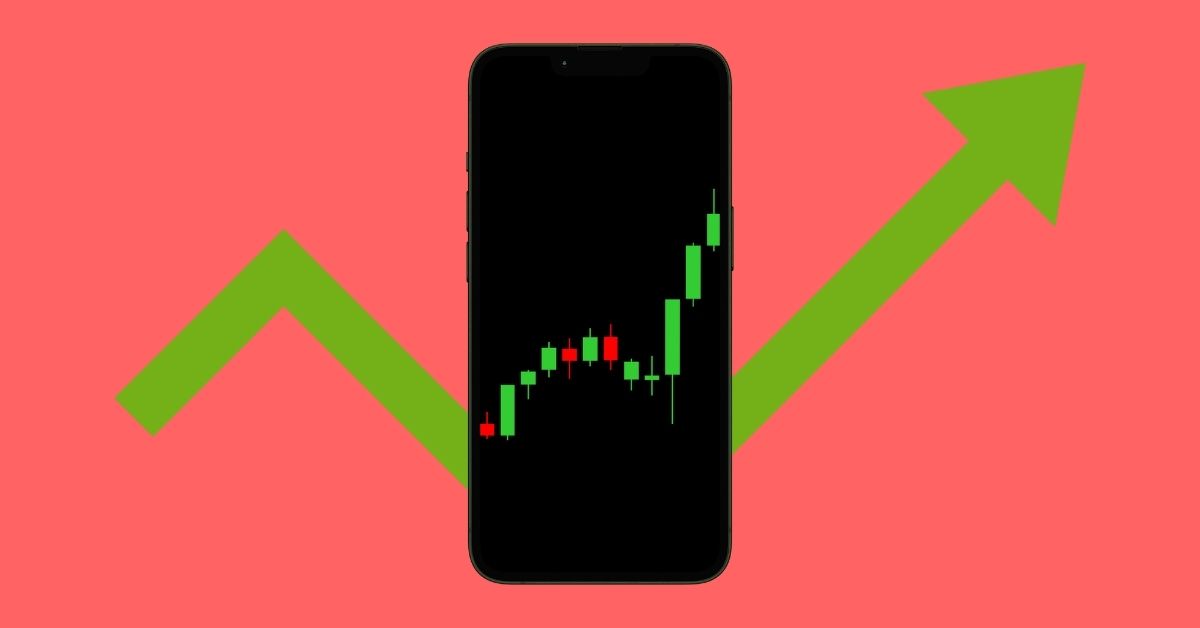
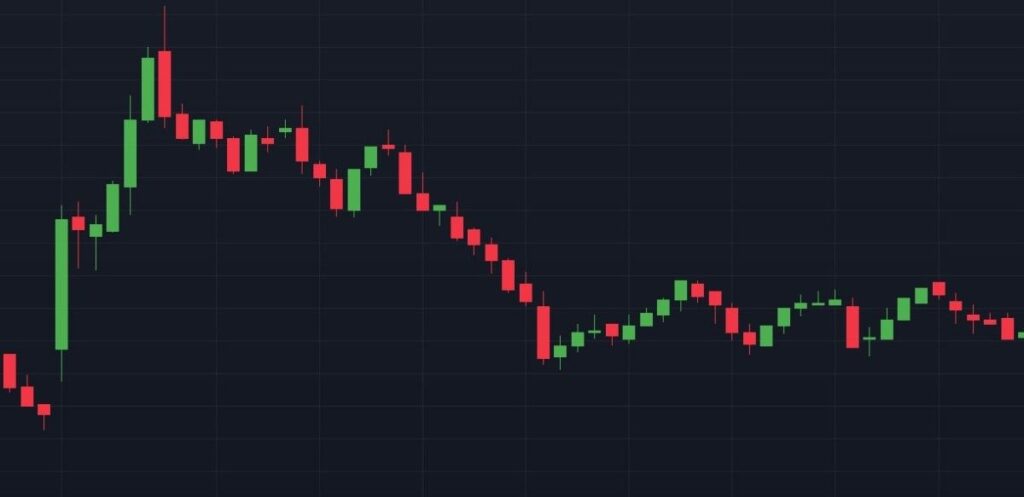
Look at this candlestick chart. Other candlestick charts will appear here. Multiple candlesticks with short patterns will appear like this. Movement in the market will appear. Checkout
What is a Candlestick Chart?
The candlestick body shows the price value of the assets, securities, products, currencies, and commodities, etc., specific to that time period and shadows ( wick). This shows that prices are high and low, reaching that time period
Body and wicks (shadows)
The starting specific timing point is when the candle and then that candle when ending time is the price point that is lower than that candle and its shadows ( wick ). This shows that the price high and low were reached at that time
When the price reaches up maximum high point, that is called the high of that candle, and the low is the candle’s maximum reach that lower point, which is called the low of that candle
How to Analyse Candlestick Chart
A candlestick chart is a chart that visually displays the price and movement in the market. Many traders use it to identify price movements in the market.
The body of a candlestick shows the price behaviour of the candle. It specifically shows how much price movement there was between the open and close of the market and a candlestick.
Candlestick wicks show the highest increases and decreases in price in the market, showing how much the price has increased and how much the price has decreased at the same time.
If the candle body is small and its wick is somewhat large, then the price open in the market is high, but the market is not able to stay at the price for long because of the reason stated.
Understanding time frames and their significance
First, you understand the timing of trading and what time frame you analyse the chart, and there are different types of time frames in trading. First, identify which type of trader you are. Analyse that time frame; you are a beginner in trading, and then you understand that the time frame is what time you trade. At that time, significance shows the candle you are just seeing in a 5-minute time frame, which shows the 5-minute candle shows what price movement in that period, many trades in 5 minutes, and 15-minute trades in the market. You can use this time frame. Just intraday trading only
Identifying trends using candlestick charts
How do you identify the market trend using candles in the real market, and with examples
Bullish: Are you seeing chat, you see only bullish candles that are moving in up uptrend now, then that trend is in up and that candles are big bullish candles that show strong upside that saw
Bearish: When we see multiple Bearish candles that are moving downside in the market, that indicates the market is now in a downtrend.
How to Read and Interpret Candlestick Patterns:
There are many candles on the market. I tell you what common candles they use and what single candles are, and Multiple candlesticks. These two types are candles are used in the market
Single candlestick patterns
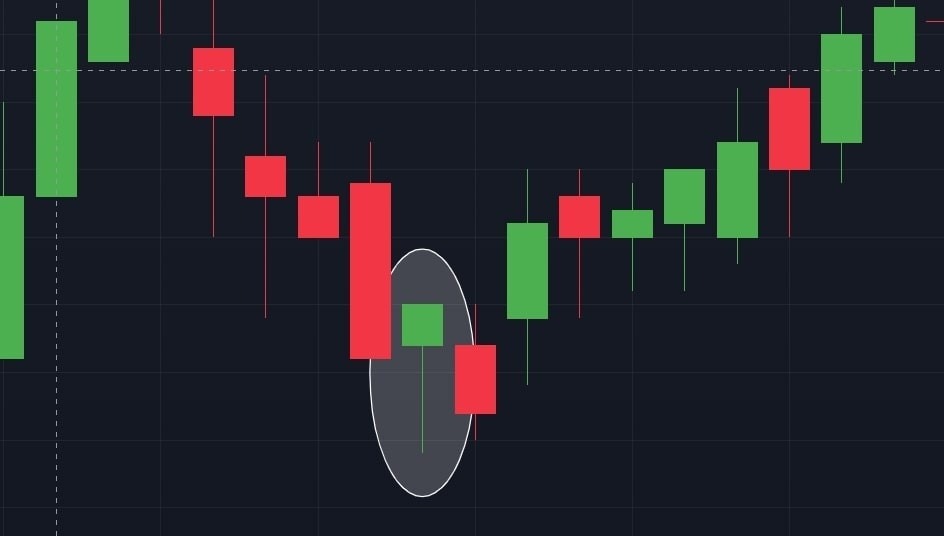
Single candlestick patterns are key price action signals that help traders predict potential reversals or continuations in the market. Each candle tells a story of the battle between bulls (buyers) and bears (sellers).
Hammer: shows a small body with a long lower wick appearing after a downtrend, telling us sellers pushed prices down but buyers fought back strongly to close near the opening, suggesting a potential bullish reversal when confirmed by the next candle.
Inverted Hammer displays a small body with a long upper wick forming in a downtrend, revealing buyers attempted to rally but faced resistance, yet if the next candle moves higher, it signals a possible trend reversal as buying pressure builds.

Shooting Star: appears after an uptrend with a small body and long upper wick, showing buyers initially drove prices up but sellers overwhelmed them to close near the open, warning of a potential bearish reversal when confirmed.
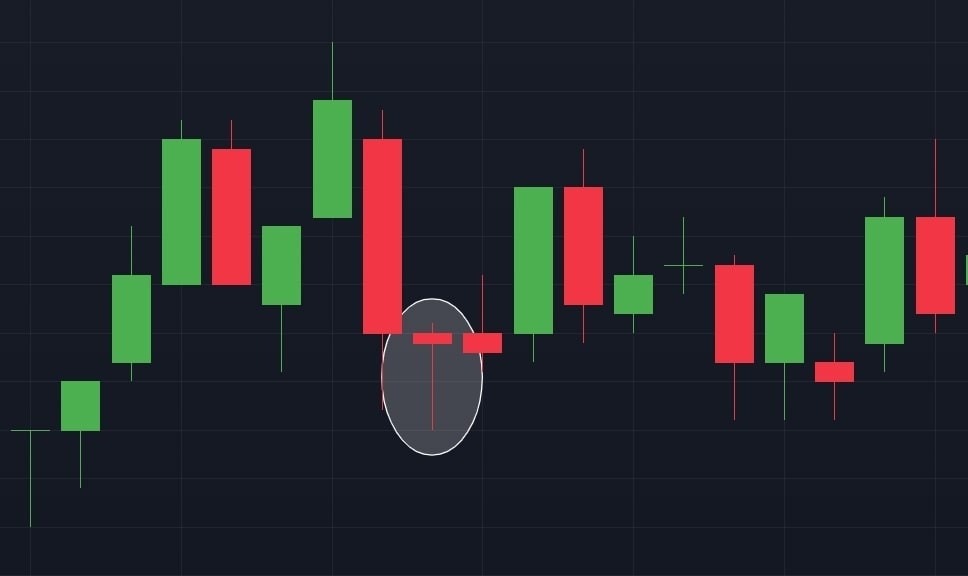
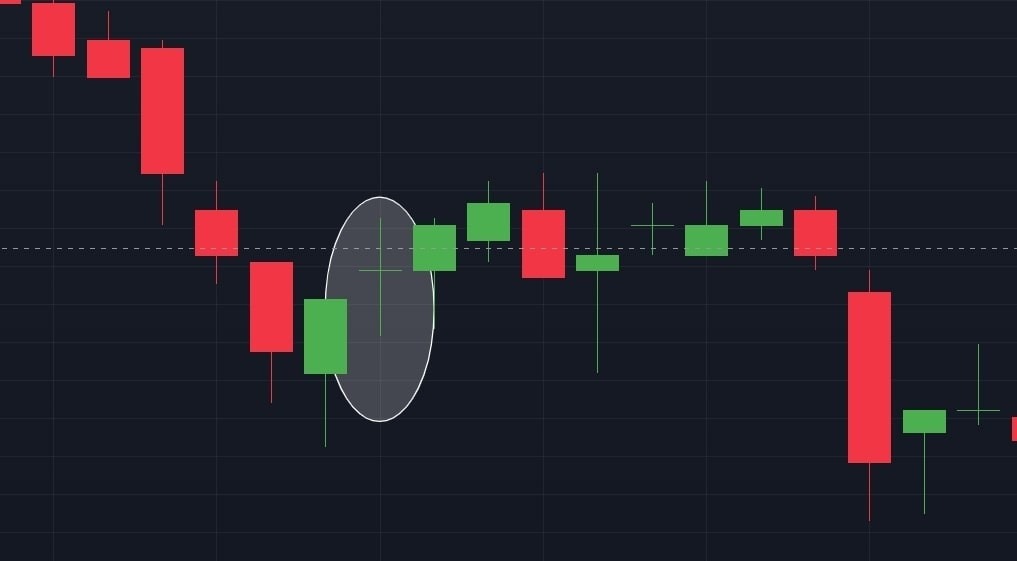
Doji candle: features nearly identical open and close prices with long wicks, representing market indecision where neither bulls nor bears gained control, often signalling potential reversal when appearing after strong trends.
Multiple candlestick patterns
1. Engulfing Pattern (Bullish & Bearish)
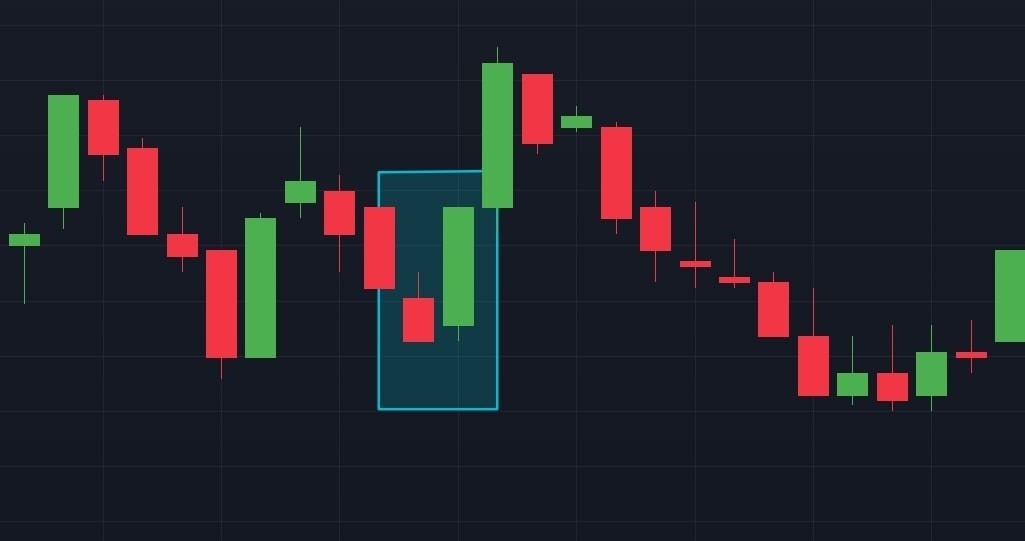
The bullish engulfing pattern forms when a small bearish candle is completely swallowed by a larger bullish candle after a downtrend, showing buyers have overwhelmed sellers and a strong reversal is likely. Its bearish counterpart appears in uptrends when a small bullish candle gets engulfed by a large bearish one, signalling sellers have taken control with potential downside ahead – both patterns gain strength when accompanied by higher volume.
2. Morning and Evening Stars
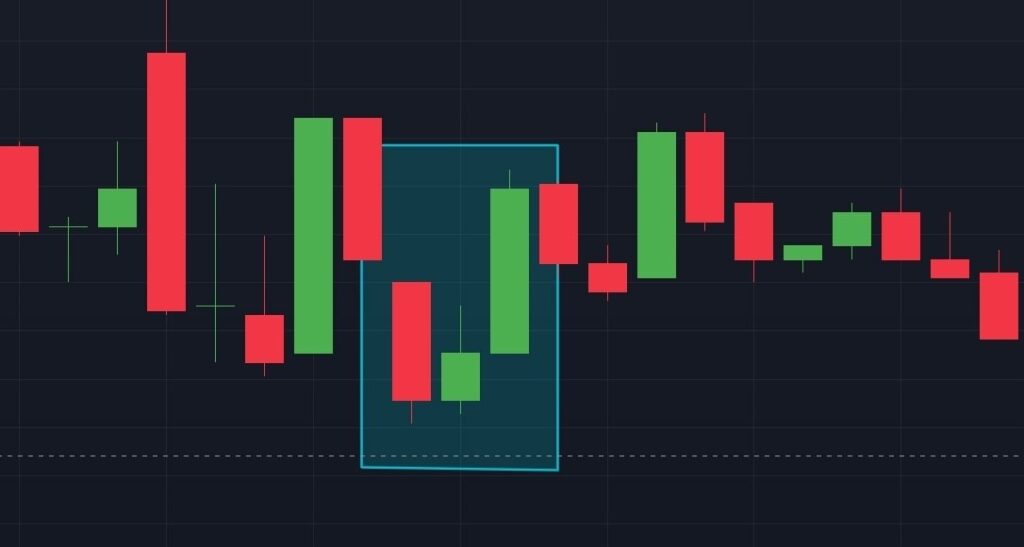
The morning star is a three-candle bullish reversal pattern where a long bearish candle is followed by a small indecisive candle (like a doji or spinning top) that gaps down, then a large bullish candle gaps up and closes above the midpoint of the first candle, marking a potential bottom after a downtrend. The evening star is its bearish mirror, forming at tops when a long bullish candle is followed by a small indecision candle and then a large bearish candle that closes below the midpoint of the first candle.
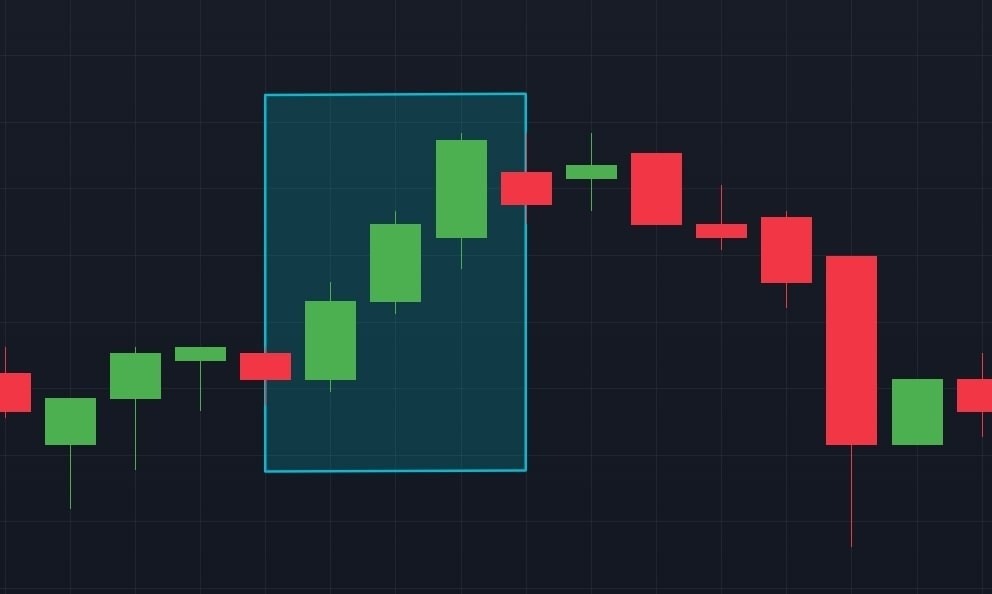
3. Three White Soldiers & Three Black Crows
Three white soldiers appear as consecutive long bullish candles with small wicks after a downtrend, each opening within the previous candle’s body and closing near its high, showing consistent buying pressure that often starts new uptrends. Three black crows are their bearish equivalent – three long red candles appearing after uptrends where each opens within the prior candle’s body and closes near its low, demonstrating persistent selling pressure that frequently leads to downtrends.
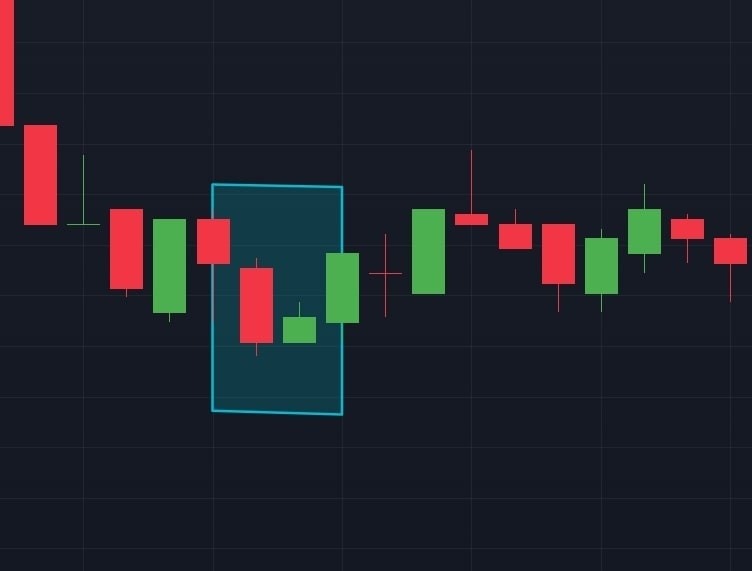
4. Harami Pattern (Bullish & Bearish)
The bullish harami shows a large bearish candle followed by a small bullish candle completely contained within the prior candle’s body, suggesting selling momentum is weakening after a downtrend. The bearish harami appears in uptrends when a large bullish candle is followed by a small bearish candle nested within it, indicating buying pressure may be exhausting – both patterns require confirmation from subsequent price action, but can provide early reversal signals when they form at key support/resistance levels.
Conclusion
I hope you all understand what candles are nd how to use them in a chart, and how to analyse candles in the real market, and different types of candles, and I will explain some single candles and multiple candles patterns. I hope you understand any questions below the comment, and contact me for more interesting blog posts. Check out moneykoan