The Relative Strength Index (RSI) is the most popular momentum oscillator indicator used in technical analysis to find what is the trend in the market and measure the what is speed and change of price movements in the market. This indicator, developed by J. Welles Wilder, the RSI ranges between 0 and 100 and helps traders identify overbought and oversold conditions in the market.
What Happens RSI is Below 30 or Above 70? It tells you whether a stock is moving too fast (overbought) or too slow (oversold), helping to understand traders make smarter decisions.
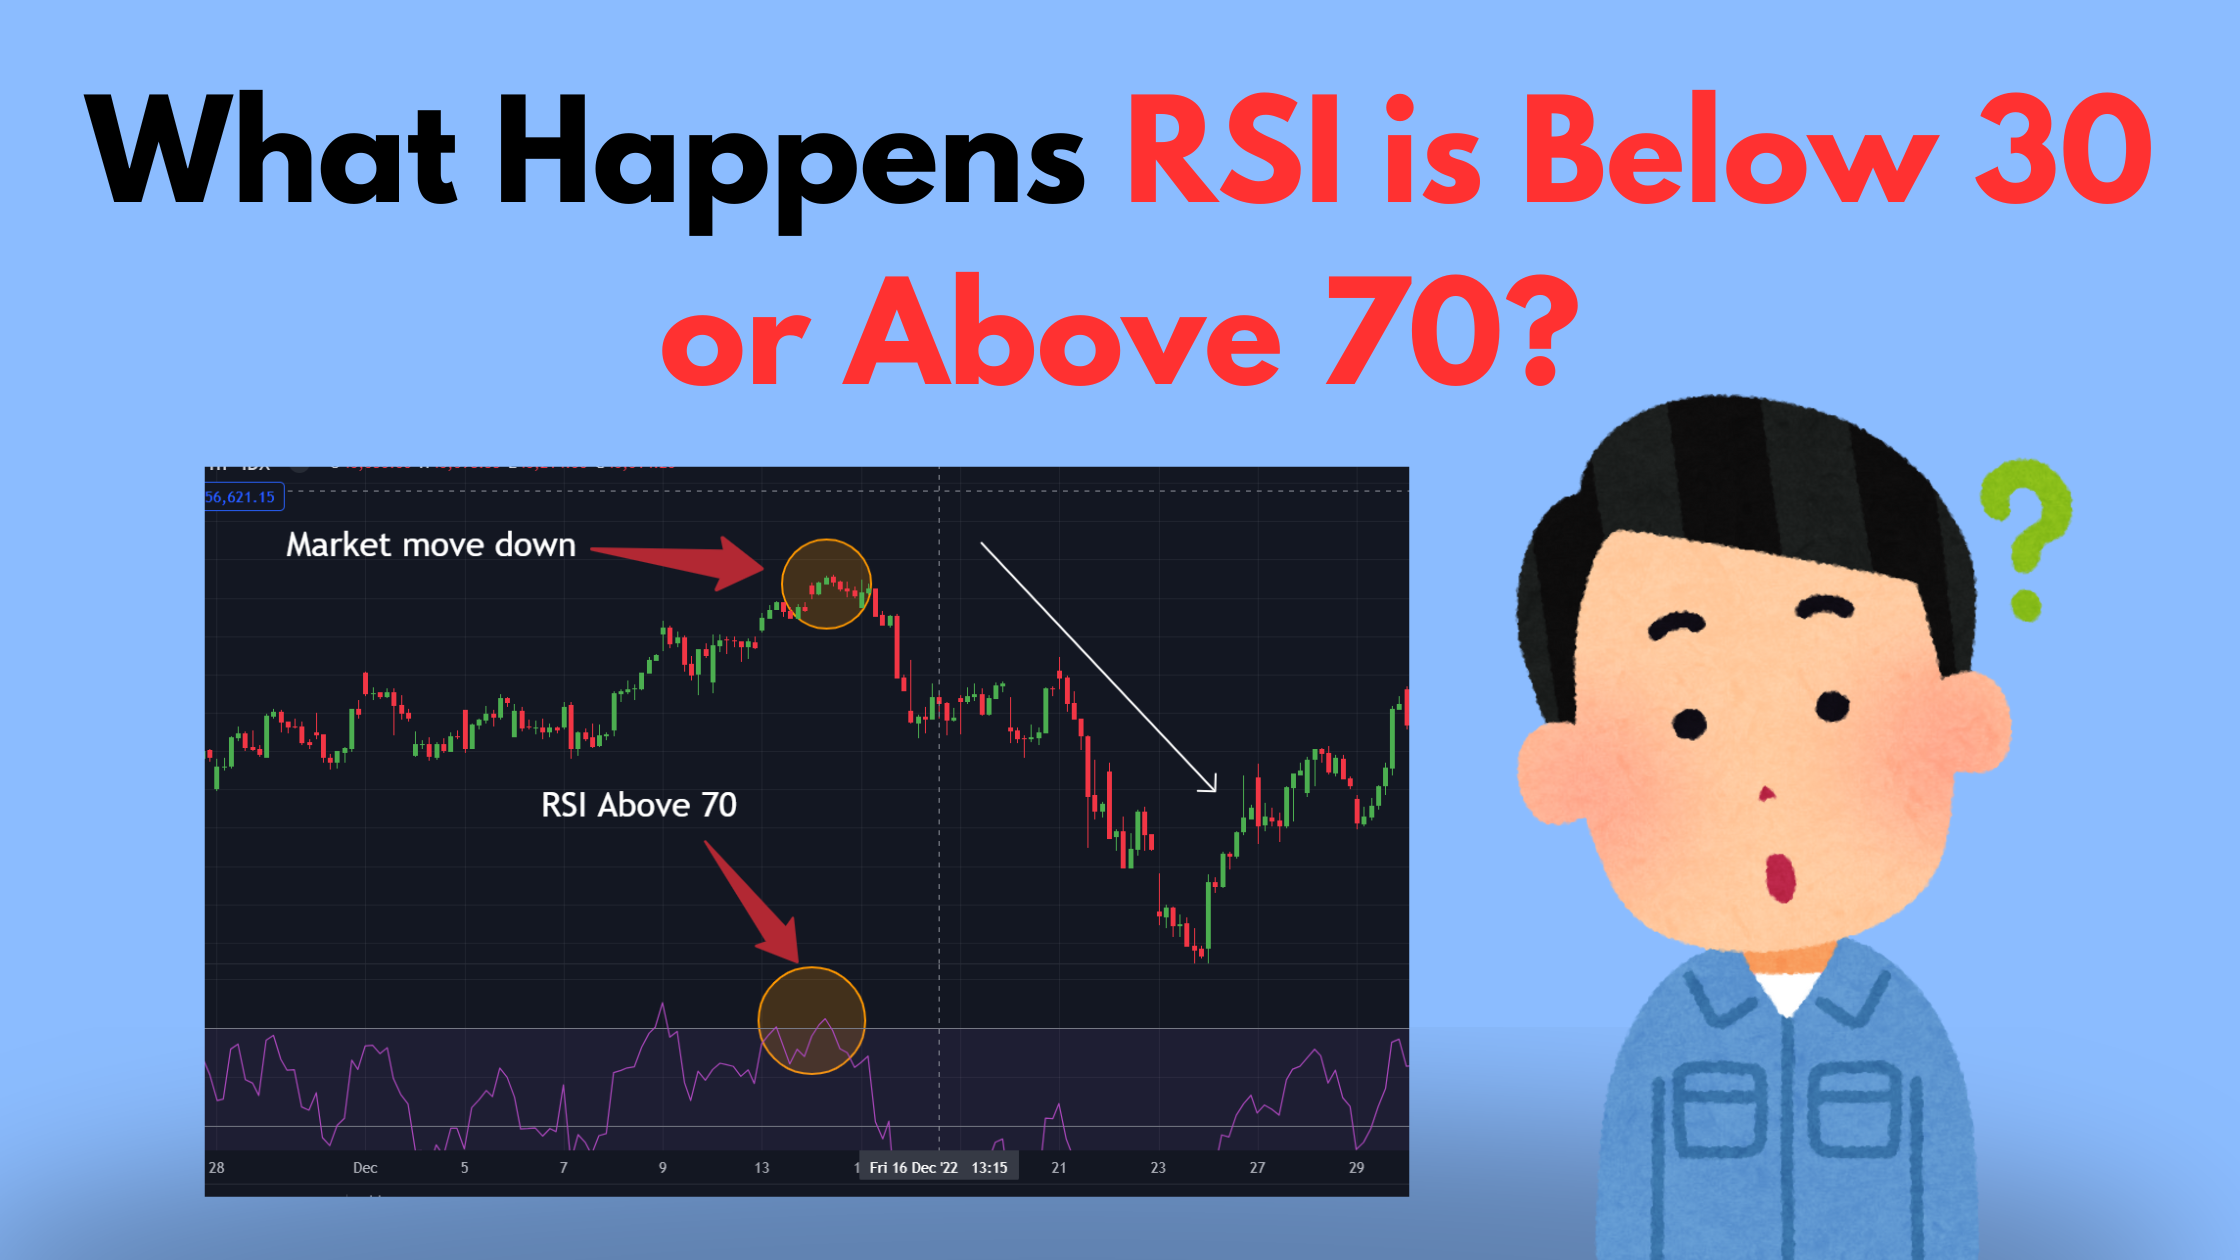
What Happens RSI is Below 30 or Above 70?
What Happens RSI is Below 30?
What happens when the (RSI) Relative Strength Index is below 30? It is oversold in the stock market, which means it may be undervalued. That price may not interest them in buying the stock. This is reflected in the RSI when below 30, it helps traders identify the price movement

Oversold Signal
- RSI below 30 suggests that selling pressure is high in the stock, and the price may have dropped too far, too fast.
- Traders watch for a possible reversal or bounce in price. Check the chart in TradingView
Potential Buying Opportunity
- intraday traders or swing traders might see this as a chance to buy at a discount, expecting a price recovery.
- However, buying solely based on RSI < 30 can be risky if the downtrend is strong.
Sometimes when RSI below 30 is high selling pressure in a stock, this time not move in upside stock, but in a strong bear market, RSI can stay below 30 for extended periods, indicating sustained selling pressure.

False Signals & Risks
- Oversold ≠ Immediate Rebound – Some assets (like heavily shorted stocks or crashing markets) can remain oversold for a long time.
- Always use additional confirmation (volume, trendlines, fundamentals) before trading.
What to Do If RSI is Below 30?
When the RSI is below 30, what do you see your trading in RSI use price action and use Candlesticks and multiple Candlestick Patterns? Use those candles and trade that candles like a see Candlesticks and multiple Candlestick Patterns in RSI below in 30 when breaking the candles that the stock takes trade
Look for Bullish Confirmation (Avoid False Signals)
Before buying, check for these signs of strength
- Hammer, Bullish Engulfing, Morning Star, Piercing Line, Pin bar near support.
Trendline Break (Upside) - Price breaks a descending trendline with rising volume.
Bullish Divergence - Price makes lower lows, but RSI makes higher lows (signalling weakening selling pressure). Support Level Bounce
- Price holds a key support level (e.g., previous lows, moving averages).

Consider Buying (If Trend is Reversing)
- Aggressive Entry: Buy near the RSI < 30 zone with tight stops (if other confirmations align).
- Conservative Entry: Wait for RSI to cross back above 30 (confirms short-term momentum shift).
- Scalping/Swing Trade: Use for quick bounces in range-bound markets.
Set Stop-Losses (Mandatory Risk Management)
- Place stops below the recent swing low (if buying for a reversal).
- If trading a bounce, use ATR (Average True Range) for volatility-adjusted stops (e.g., 1.5x ATR below entry).
- Trail stops up as price rises to lock in profits.
Avoid Common Mistakes
Buying Blindly:- Just because RSI < 30 doesn’t mean it can’t go lower (e.g., in a crash or panic sell-off).
Ignoring the Trend:- In a strong downtrend, wait for a higher low or break of structure before buying. No Confirmation:- Always pair RSI with price action or volume analysis.
Example Trade Setup

- Stock drops sharply, RSI hits 30.
- Confirmation:
- A bullish hammer candle forms at a key support level.
- RSI shows bullish divergence (higher low while price makes lower low).
- Entry: Buy if the price breaks the candle’s high.
- Stop-Loss: Below the hammer’s low.
- Target: Previous resistance or 1:2 risk-reward.
What Does It Mean When RSI is Above 70?
You see, when below 30 RSI, what do? But when RSI is 70, what do you do? Let’s see what you’re in stock when 70 above? Someone tell that whose RSI is above 70, they’re talking about a technical condition in the market known as “overbought.” But what exactly does that mean? And more importantly, how should you react to it?
What RSI (Relative Strength Index) over 70 truly signals, what typically happens to prices afterwards, and how you can smartly interpret these movements. It’s a popular indicator, sure—but using it blindly can cost you. See the real market saw about RSI (Relative Strength Index) over 70.
Standard RSI Range and Thresholds
RSI values fall between 0 and 100, and here’s how traders typically read them. The 70 mark is our main focus in this article. When RSI is above 70, many traders take it as a warning sign that a correction or pullback could be near. But as we’ll soon see, it is not always that simple.
- 0–30: Oversold – potential buying opportunity
- 30–50: Weak momentum
- 50–70: Bullish trend building
- Above 70: Overbought – potential selling or pullback zone
What Happens to Prices in Overbought Conditions?
- Price Pullback: The asset takes a short-term dip or corrects downward as traders take profits.
- Consolidation: Price moves sideways for a while as the market cools off, RSI drops back below 70.
- Continued Rally: If the trend is strong, RSI might stay above 70 for a long time—yes, that’s possible.
RSI Above 70 = Overbought Condition
When RSI crosses above the 70 level, traders often call this the overbought zone. This saw is overvalued in the short term due to high buying pressure in stock
This doesn’t mean you should sell right away. What it really means is: be cautious. The asset is heated, and it may soon face selling pressure as traders take profits or as buyers begin to hesitate.
RSI above 70 is usually a sign that an asset has been in a strong uptrend. It means buyers have been dominating, pushing prices higher
RSI Momentum like
- Rapid consecutive gains in price
- Lack of pullbacks or corrections
- Market sentiment is euphoric
- High volume on bullish days
Overbought Condition

Why Prices May Drop or Correct After RSI Hits 70+
Profit Taking by Traders
One of the most common reasons prices drop after RSI goes above 70 is that experienced traders start locking in profits. When momentum indicators flash “overbought,” it can act as a cue to start trimming positions. Especially for swing traders and short-term investors, this level is psychologically important.
And what happens when many people sell at the same time? That’s right—a price drop.
Traders who’ve been riding the uptrend want to protect their gains, especially if other indicators also hint that the rally is stalling. This collective behaviour often leads to short-term corrections.
Technical Resistance Zones in RSI
Another reason prices might fall is the presence of resistance levels. These are price points where an asset has historically struggled to rise above. When RSI is above 70 and the price is nearing a known resistance, it creates a double warning.

- Overbought on the RSI
- Hitting a ceiling on the chart
That’s often enough to cause a mini panic or pullback. Smart traders notice this and act fast, which further fuels the correction.
Also, understand how RSI is calculated
The standard RSI is calculated over a 14-period timeframe. The formula is a bit math-heavy, but in essence, it compares the magnitude of recent gains to recent losses. It looks like this:
RSI = 100 – [100 / (1 + RS)], where RS is the average gain divided by the average loss over the past 14 periods.
Psychological Impact of Overbought Markets
Don’t underestimate the power of psychology in trading. When retail investors see RSI readings above 70, they often get nervous. Nobody wants to be the last one holding the bag.
There’s also FOMO—fear of missing out—that drives prices up. But once the market realizes that prices have gone “too far,” the same emotion flips into fear of loss, and you get a rush of exits.
Common RSI Trading Mistakes to Avoid
Selling too early at RSI 70 – Just because RSI hits 70 doesn’t mean the price will drop immediately. It can go higher. Ignoring the trend, RSI works differently in uptrends and downtrends. Always check the market direction first.
Relying only on RSI – Don’t use RSI alone. Combine it with other indicators for better decisions. Misreading divergence – RSI divergence doesn’t always mean reversal. Wait for clear confirmation.
Using default settings for everything – The 14-period RSI doesn’t work best for every trade. Adjust it based on your strategy. Not checking volume – RSI with low volume is weak. Always check the volume to see if the move is strong.
Expecting quick reversals – RSI over 70 doesn’t mean the price will fall right away. Be patient. Trading during news events – RSI is less reliable during big news. Avoid using it at those times.
Chasing high RSI trades – Don’t buy just because the price is going up fast. Wait for a better entry. Ignoring risk management – Always use stop-losses and manage your risk. No trade is guaranteed.
FAQs
Is RSI under 30 good?
Yes, RSI under 30 can signal an oversold condition and a potential buying opportunity.
What is the 60 60 50 RSI strategy?
It’s a trend-following strategy using RSI 60 as support in uptrends and RSI 50 as a base level.
What is the 70 30 rule in RSI?
The 70/30 rule means RSI above 70 is overbought and below 30 is oversold.
What to do when RSI is low?
Look for potential buying setups or trend reversal signs when the RSI is low.
Conclusion
See that rasi what do in below 30 and also you see rasi what do rsi when 70 above you. Any more questions, comment me and contact me. Achieve smarter, higher returns with lower risk by following expert-backed strategies—only on MoneyKoan.